In the world of information, knowledge is power but data is just as important. Data about users, customers, consumers and citizens allow us to improve accessibility processes and the transfer of information, to learn about the information search behaviors of readers and visitors, and improve our service.
The next post displays the possibilities to learn about our system’s users (readers / customers / citizens) by tracking the users’ information behavior through Google Analytics.
In the two recent versions (since version 8.0) of IDEA, we have added the option to implement a fixed parameter for sending data from the catalog of public online archive or library to a Google Analytics where you can see data about site usage, user experience, times of usage and especially popular items as books, photos, videos, files or various entries in the catalog.
Please note: this post does not replace the official explanation of IDEA for working with the system that receives usage data in the Analytics. IDEA customers can contact our support department for explanations, assistance by contacting the following email: [email protected] or by using the form below in our website: Contact.
General Data – general terminology of Google Analytics in a nutshell:
- Sessions: the total number of sessions during the date range. A session is the period of time that a user is actively involved in the site. All usage data, such as multiple screen views and events associated with the session.
- Page-views: ‘Page views’ is the total number of pages viewed. This displays the number of repeated views of a single page.
- The average duration of activities in the site: The average duration of the activity in the site.
- Users: Users who performed at least one activity in site within the selected date range. This includes both new users and returning users.
An example for a dashboard with the general data:
Website Content Monitoring -tracking surfing activities and times of browsing the catalog
We can track various publications, links in other sites that published information about our archive or library, and view different time formats.
Now, we want to get information about pages according to their names on the website
First, go to the ‘main features’ line above the table and select the ‘Page Title’ option. Now the table will change to display the familiar names and content pages .
As you can see in the table, the data is divided into pages targeted, according to the names and titles given by you to items / queries and content in the catalog:
In this table you can see the names of the items already known to you: i.e.: “A MAN CALLED OVE”. The basic cutting of the table allows us to see how much time in average users spent on each such page, how many unique entries were carried out by users into these specific pages and page views in general.
This data may be especially important to us as administrators of the archive or library’s software, when we want to get details about the popular items in our catalog, whether these are new and trendy books or other photographs and information items in our archive.
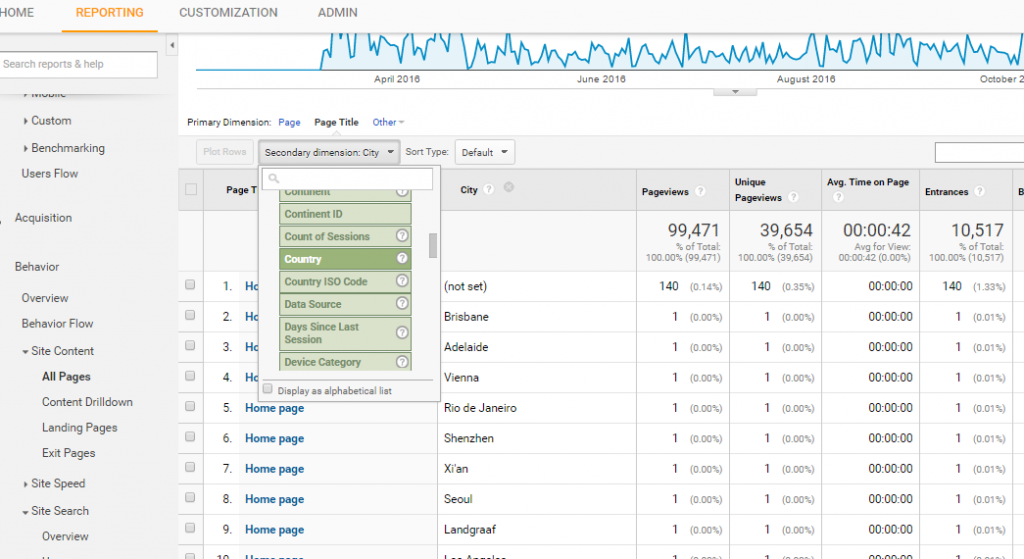
Secondary dimension: Beyond the basic variables of pages display, times of usage in the site and additional content, we can get information about additional variables such as technology (i.e. distribution of pages display and examining their distribution according to operating systems, browsers and mobile devices). For example, we can add a geographic variable and select: Secondary dimension> Users > region.
Now that we have defined the secondary variable, we can see an additional column named region: Now distribution is in accordance with regions in the country and abroad, taking geographical distribution of regions in the country and in the world:
In conclusion, Google Analytics has been an important turning point in the management of sites, and its various capabilities allow us expanded learning, producing important information about our users whether it is the management system of the archive or the library’s program. The actual data help us to ‘see’ our users and our readers better, to identify their needs and trace their information behavior in a visual manner.


